Define and mesh 2D geometries
Netgen-python allows to define 2D geometries by means of boundary curves. Curves can be lines, or rational splines of 2nd order.
import netgen.geom2d as
We generate a geometry object, and add geometry control points:
geo = geom2d.SplineGeometry()
p1 = geo.AppendPoint (0,0)
p2 = geo.AppendPoint (1,0)
p3 = geo.AppendPoint (1,1)
p4 = geo.AppendPoint (0,1)
p1 to p4 are indices referring to these points. Next, we add the 4 sides of the square:
geo.Append (["line", p1, p2])
geo.Append (["line", p2, p3])
geo.Append (["line", p3, p4])
geo.Append (["line", p4, p1])
The lines are oriented such that the domain is on the left side when going from the first point to the second point of the line.
We generate a mesh, where the maxh arguments specifies the desired maximal global mesh-size.
mesh = geo.GenerateMesh (maxh=0.1)
You can iterate over points and elements of the mesh:
for p in mesh.Points():
 x,y,z = p.p
 print ("x = ", x, "y = ", y)
 for el in mesh.Elements2D():
   print (el.vertices)
Curved boundaries
Instead of line segments, we can use second order rational splines, which give an exact representation of ellipses. They are described by three points defining the control polygon. The curve and its tangential direction coincides with the control polygon at the start and the end-point.
The following defines a quarter of a circle:
geo = geom2d.SplineGeometry()
p1,p2,p3,p4 = [ geo.AppendPoint(x,y) for x,y in [(0,0), (1,0), (1,1), (0,1)] ]
geo.Append (["line", p1, p2])
geo.Append (["spline3", p2, p3, p4])
geo.Append (["line", p4, p1])
Multiple subdomains
As default, the domain is left of the segment. If you have several subdomains, you specify the subdomain numbers left and right of the segment. Outside is given as subdomain number 0. Default values for leftdomain and rightdomain are 1 and 0, respectively. The following example gives two squares:
geo = geom2d.SplineGeometry()
p1,p2,p3,p4 = [ geo.AppendPoint(x,y) for x,y in [(0,0), (1,0), (1,1), (0,1)] ]
p5,p6 =  [ geo.AppendPoint(x,y) for x,y in [(2,0), (2,1)] ]
geo.Append (["line", p1, p2], leftdomain=1, rightdomain=0)
geo.Append (["line", p2, p3], leftdomain=1, rightdomain=2)
geo.Append (["line", p3, p4], leftdomain=1, rightdomain=0)
geo.Append (["line", p4, p1], leftdomain=1, rightdomain=0)
geo.Append (["line", p2, p5], leftdomain=2, rightdomain=0)
geo.Append (["line", p5, p6], leftdomain=2, rightdomain=0)
geo.Append (["line", p6, p3], leftdomain=2, rightdomain=0)
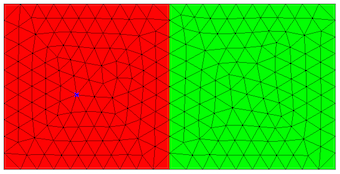
The obtained mesh looks like below. You get the red color by double-clicking into the subdomain.

Boundary condition markers
You can specify a boundary condition number for each segment, which can be used to specify boundary conditions in the simulation software. It must be a positive integer.
geo.Append (["line", p1, p2], bc=3)
New features since Nov 2, 2015:
You can set segment-wise and domain-wise maximal mesh-size:
geo.Append (["line", p1, p2], maxh=0.1)
geo.SetDomainMaxH(2, 0.01)
You can give labels for boundary conditions and domains materials:
geo.Append (["line", p1, p2], bc="bottom")
geo.SetMaterial(2, "iron")
You have templates for defining circles and rectangles:
geo.AddCircle(c=(5,0), r=0.5, leftdomain=2, rightdomain=1)
geo.AddRectangle((0,0), (3,2))
New feature since Nov 26, 2015:
Generation of quad-dominated 2D meshes:
geo.GenerateMesh(maxh=..., quad_dominated=True)